


938 reads
A Simple Guide to Log JavaScript Events to the Console for Debugging


Too Long; Didn't Read
A Simple Guide to Log JavaScript Events to the Console for Debugging is published by Matthias Kupperschmidt Freelancer for SEO & Web Analytics. The monitorEvents API allows you to log any occurring JavaScript event to the console in Chrome. It's for example important when debugging a web page to see how many submit events a form element sends out. With this method you prevent sending and tracking browser events multiple times. It is the quickest way to monitor all JavaScript events that I know of.Companies Mentioned


Let's look at how to debug all JavaScript events and log them to the console with a nifty trick.
It's for example important when debugging a web page to see how many submit events a form element sends out.
With this debugging method you prevent sending and tracking browser events multiple times.
Listen for all events in JavaScript
There is a handy API in Chrome developer tools that makes this easy.
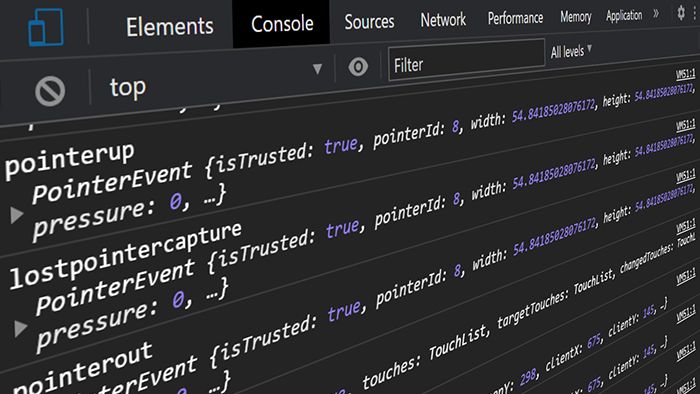
The monitorEvents API allows you to log any occurring JavaScript event to the console in Chrome. You just have to give it an element and optionally the event you want to listen to:
monitorEvents(element[,event])If you want to stop listening for events again, you simply use:
unmonitorEvents(element[,event])Example: Log all click events of the window object to the console


Now with this helpful debugging tool in our toolbox, we can for example select a form element in Chrome developer tools to start monitoring submit events.
After you select the element in the elements tab, Chrome Dev Tools will show a little $0 sign next to it.
If you keep the HTML-Element selected, you can now use the $0 to quickly reference the element in the console - without needing a CSS selector. Now together with the monitorEvents API you can quickly and easily listen to all ongoing JavaScript events and print them to the console for debugging:

This is helpful for all kinds of event tracking because you can debug every JavaScript event in the console without having to run the GTM Debugger.
So there you have it. By using Chrome Dev Tools' API, it is the quickest way to monitor all JavaScript events that I know of.
Let me know on Twitter if it worked for you and if you liked this. ✌️
Previously published at https://bluerivermountains.com/en/log-all-javascript-events

L O A D I N G
. . . comments & more!
. . . comments & more!
About Author

TOPICS
THIS ARTICLE WAS FEATURED IN...


RELATED STORIES


What the Do-While Is ZeptoN? #coding
Jan 20, 1970


7 Online Radio Stations For Coders 🎵💖 #programming
Jan 20, 1970

