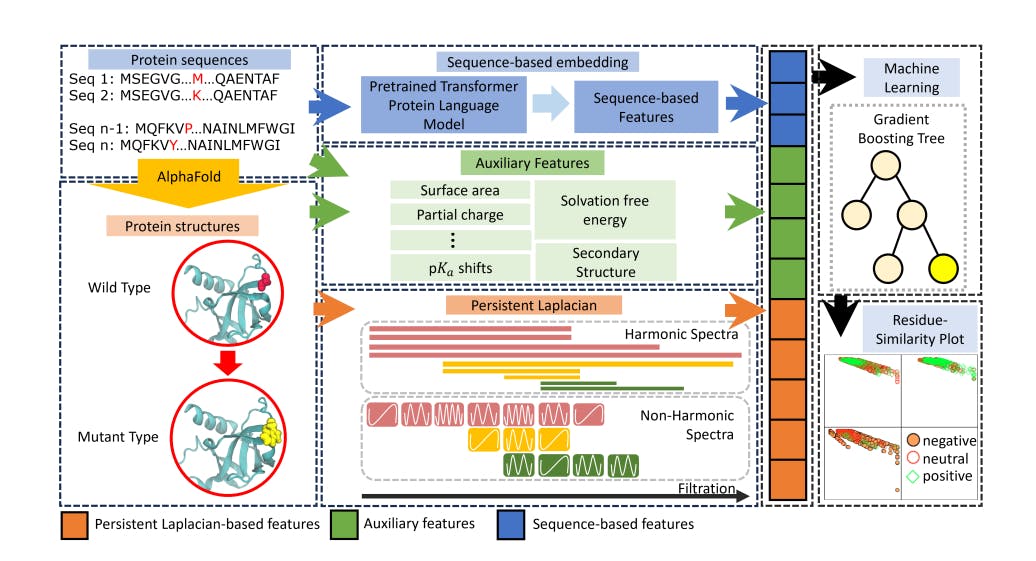
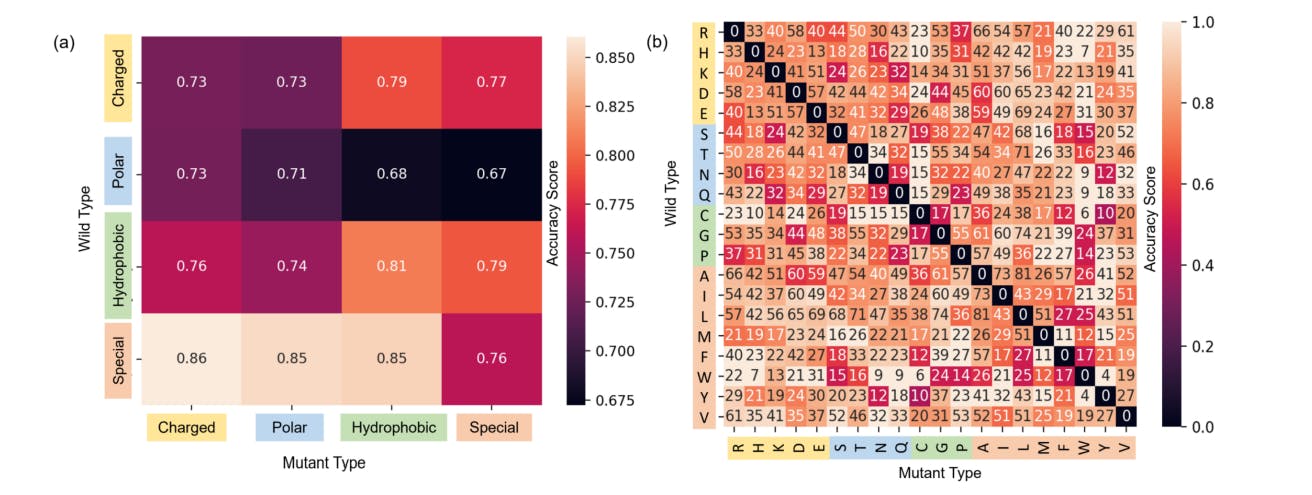
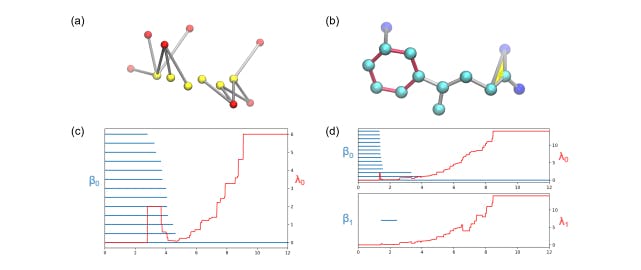
paint-brush
Unveiling Protein Solubility Patterns: Insights from TopLapGBT's Performance Analysisby@mutation
115 reads

Unveiling Protein Solubility Patterns: Insights from TopLapGBT's Performance Analysis

by The Mutation PublicationFebruary 16th, 2024
Read on Terminal Reader
Read this story w/o Javascript
tldt arrow

Too Long; Didn't Read

Explore TopLapGBT's analysis of protein solubility patterns, offering insights into mutation impact and protein engineering. Leveraging structural data from AlphaFold2 and advanced machine learning techniques, TopLapGBT reveals nuanced relationships within protein structures. Discover its performance across mutation regions and types, revolutionizing biomolecular research.
featured image - Unveiling Protein Solubility Patterns: Insights from TopLapGBT's Performance Analysis
The Mutation Publication HackerNoon profile picture

Authors:

(1) JunJie Wee, Department of Mathematics, Michigan State University;

(2) Jiahui Chen, Department of Mathematical Sciences, University of Arkansas;

(3) Kelin Xia, Division of Mathematical Sciences, School of Physical and Mathematical Sciences Nanyang Technological University & [email protected];

(4)Guo-Wei Wei, 1Department of Mathematics, Michigan State University, Department of Biochemistry and Molecular Biology, Michigan State University, Department of Electrical and Computer Engineering, Michigan State University & [email protected].

Abstract & Introduction

Results

Discussion

Conclusion

Materials and Methods

Software and resources, Code and Data Availability

Supporting Information, Acknowledgments & References

3 Discussion

The performance of machine learning models generally relies on the nature of the input features. In our model, the PL-based features depend on one main element which is the quality of the protein structures from AlphaFold 2 (AF2). The quality of AF2 structures are crucial in determining the performance of TopLapGBT. Recently, AF2 structures have been reported to achieve comparable performance to nuclear magnetic resonance (NMR) structures while ensemble methods can be used to enhance the performance by combining multiple NMR structures [1]. This allows AF2 structures to serve as a practical substitute for experimental structural data. Although AF2 structures are not as reliable as X-ray structures, the fusion of sequencebased pre-trained transformer features and PL-based features provides robust featurization even for low quality AF2 structural data. PL elucidates the precise mutation geometry and topology, while sequence-based pre-trained transformer features capture evolutionary patterns from an extensive sequence library. This synergy holds significance and can be applied to a diverse range of other challenges in the field of biomolecular research. For the rest of this section, we analyze the model’s performance based on the region of the mutations and the type of mutations. We also discuss the performance of different feature types using the Residue-Similarity plots.


Table 2: Performance of TopLapGBT with existing state-of-the-art models on the independent blind test classification. The negative solubility samples are denoted as ”-” whereas the positive solubility change samples are denoted as ”+”. The samples with no solubility change are denoted as ”N”. Performance metrics include the positive predicted values (PPV), negative predicted values (NPV), sensitivity, specificity, correct prediction ratio (CPR) and generalised correlation (GC2 ). PPV refers to the proportions of positive predictions for each solubility class while NPV refers to the proportions of negative predictions for each solubility class. CPR calculates the percentage of correctly classified samples while GC2 measures the correlation coefficient of the classification. All normalized metrics are also reported. For each metric, the first value is without normalization while the second one is with normalization.


3.1 Performance analysis based on different mutation regions

To delve deeper into the model’s performance, we categorize mutation samples based on their structural regions: interior and surface, as depicted in Figure 2 pre- and post-mutations. These regions are defined by their relative accessible solvent area (rASA), using a cutoff value c. A residue at the mutation site is classified as buried or interior if its rASA falls below this cutoff. While the discrete nature of c initially raised concerns, given that amino acids have a continuous exposure profile, empirical analyses on databases from organisms like Escherichia coli, Saccharomyces cerevisiae, and Homo sapiens have shown that an optimal rASA cutoff of approximately 25% is effective for distinguishing between surface and interior residues [41]. In our analysis, we apply this framework to identify surface and interior residues in the solubility dataset. We observe that some mutation sites undergo a regional transition, moving from one structural domain to another, consequent to the mutation.


To gain nuanced insights into TopLapGBT’s performance, we segment the results according to the mutation’s structural location within the protein. We present these segmentations as heatmap plots that delineate both mutation regions and amino acid types. Structural regions are defined based on relative accessible surface area (rASA) [41]. By categorizing residues as either interior or surface, we can examine the influence of continuous amino acid exposure on solubility change classification post-mutation. Figure 2(b) displays accuracy scores for four types of mutations: interior-interior, interior-surface, surface-interior, and surface-surface. TopLapGBT attains an average accuracy score of 0.770 across these categories. Extended data in Figure S1 further breaks down accuracy scores for all 20 distinct amino acids within each region-pair, revealing variations in residue-residue pair performance.

Figure 2: (a) The definitions of the structural regions on the protein label 213133708 with mutation ID: I283W. For both wild type and mutant type, amino acids in the proteins are classified under surface or interior regions based on the rASA of the residue. The residue ID 283 of protein label 213133708 was mutated from isoleucine (interior region) to trytophan (surface region). Structures are plotted with the software Illustrate[42]. (b) A comparison of performance of TopLapGBT among different mutation region types. The y-axis represents the region type for the original residue and the x-axis represents the region type for the mutated residue. The numbers indicated in each cell corresponds to the number of mutation samples in each regionregion mutation pair. The accuracy scores (CPR) for both interior-interior and interior-surface are 0.813 and 0.812 while the accuracy score for both surface-interior and surface-surface are 0.725 and 0.730.


3.2 Performance analysis based on different mutation types

Switching focus to mutation types, our model’s capability in classifying solubility changes also merits exploration across the 20 distinct amino acid types in the dataset. In addition to this, we subgroup amino acids as charged, polar, hydrophobic, or special case. Table S1 enumerates the sample counts for each mutation group pair. Figure 3(a) displays accuracy scores for each mutation group pair, while Figure 3(b) shows scores for each amino acid pair. Notably, the special-charged and special-polar groups register the highest accuracy, whereas the polarhydrophobic and polar-special groups underperform. One plausible reason could be the inherent complexity in accurately classifying mutations with non-negative solubility changes. It’s worth noting that PON-Sol2 employed a two-layer classifier to improve classification [11]. Our results indicate that TopLapGBT surpasses the performance of this two-layer system.


 Figure 3: A comparison of 10-fold cross validation accuracy scores (CPR) for (a) different mutation groups and (b) its associated amino acid types. The y-axis labels the residue type of the original protein, whereas the x-axis labels the residue type of the mutant. The squares colored in black in (b) have zero mutation samples. For a reverse mutation, the labels are taken with reverse solubility change unless the change is zero.


3.3 Feature analysis based on Residue-Similarity plots

The Residue Similarity Index (RSI) serves as a potent metric for evaluating the efficacy of dimensionality reduction in both clustering and classification contexts [43]. RSI has proven its value in generating classification accuracy scores that align well with supervised methods in single-cell typing. When applied to our solubility change dataset, Residue-Similarity (R-S) plots can be constructed to scrutinize how the Residue Index (RI) and Similarity Index (SI) may indicate the quality of cluster separation.


Figure 4 juxtaposes the R-S plots derived from TopLapGBT against those from various feature sets utilized in model training. Across all visualizations, samples manifest a range of classification outcomes—both correct and incorrect—for each true label. However, a noteworthy observation is that Transformer-pretrain and persistent Laplacian-based features demon strate superior clustering attributes compared to auxiliary features. The high RI and SI scores for auxiliary features cause these data points to cluster near the upper regions of their respective sections. Despite this, the integrative use of all three feature types in TopLapGBT results in appreciable clustering performance, corroborated by the CPR metrics obtained in 10-fold cross-validation. To solidify the rationale behind adopting robust supervised classifiers like TopLapGBT, we contrast the R-S plots with UMAP visualizations (shown in Figure S2). It becomes evident that UMAP plots fail to form clusters that are as distinct as those observed in R-S plots, thereby reinforcing the need for a specialized approach to classify mutation samples effectively.


The impetus for utilizing structure-based features stems from the multifaceted relationship that exists among protein sequence, structure, and solubility. Factors such as hydrophobicity, charge distribution, and intermolecular interactions contribute to the complexity of protein solubility. Traditional prediction methods, which often rely on empirical rules or rudimentary descriptors, fall short in capturing this intricate molecular interplay. By employing advanced mathematical techniques like persistent Laplacian (PL) coupled with machine learning algorithms, we can decipher the complex patterns and relationships embedded within protein sequences and structures. Persistent Laplacian, in particular, provides a robust mathematical representation that captures both the topological and homotopic evolution of protein structures. Furthermore, machine learning models rooted in advanced mathematics offer several advantages for classifying changes in protein solubility. These models are well-suited for handling high-dimensional and complex data sets, such as those involving protein sequences and structures. They are also capable of learning non-linear relationships and capturing nuanced dependencies that are often overlooked by traditional linear models. Importantly, these advanced models can adeptly manage class-imbalanced datasets, which are commonly encountered in protein solubility studies.


 Figure 4: The comparison of R-S plots between the different types of features used in TopLapGBT model. The y-axis represents the residue score, whereas the x-axis represents the similarity score. RS scores were computed for the testing set, and all 10-folds were visualized. Each section corresponds to one of the 3 true solubility labels, and the sample’s color and marker correspond to the predicted label from TopLapGBT.


This paper is available on arxiv under CC 4.0 license.