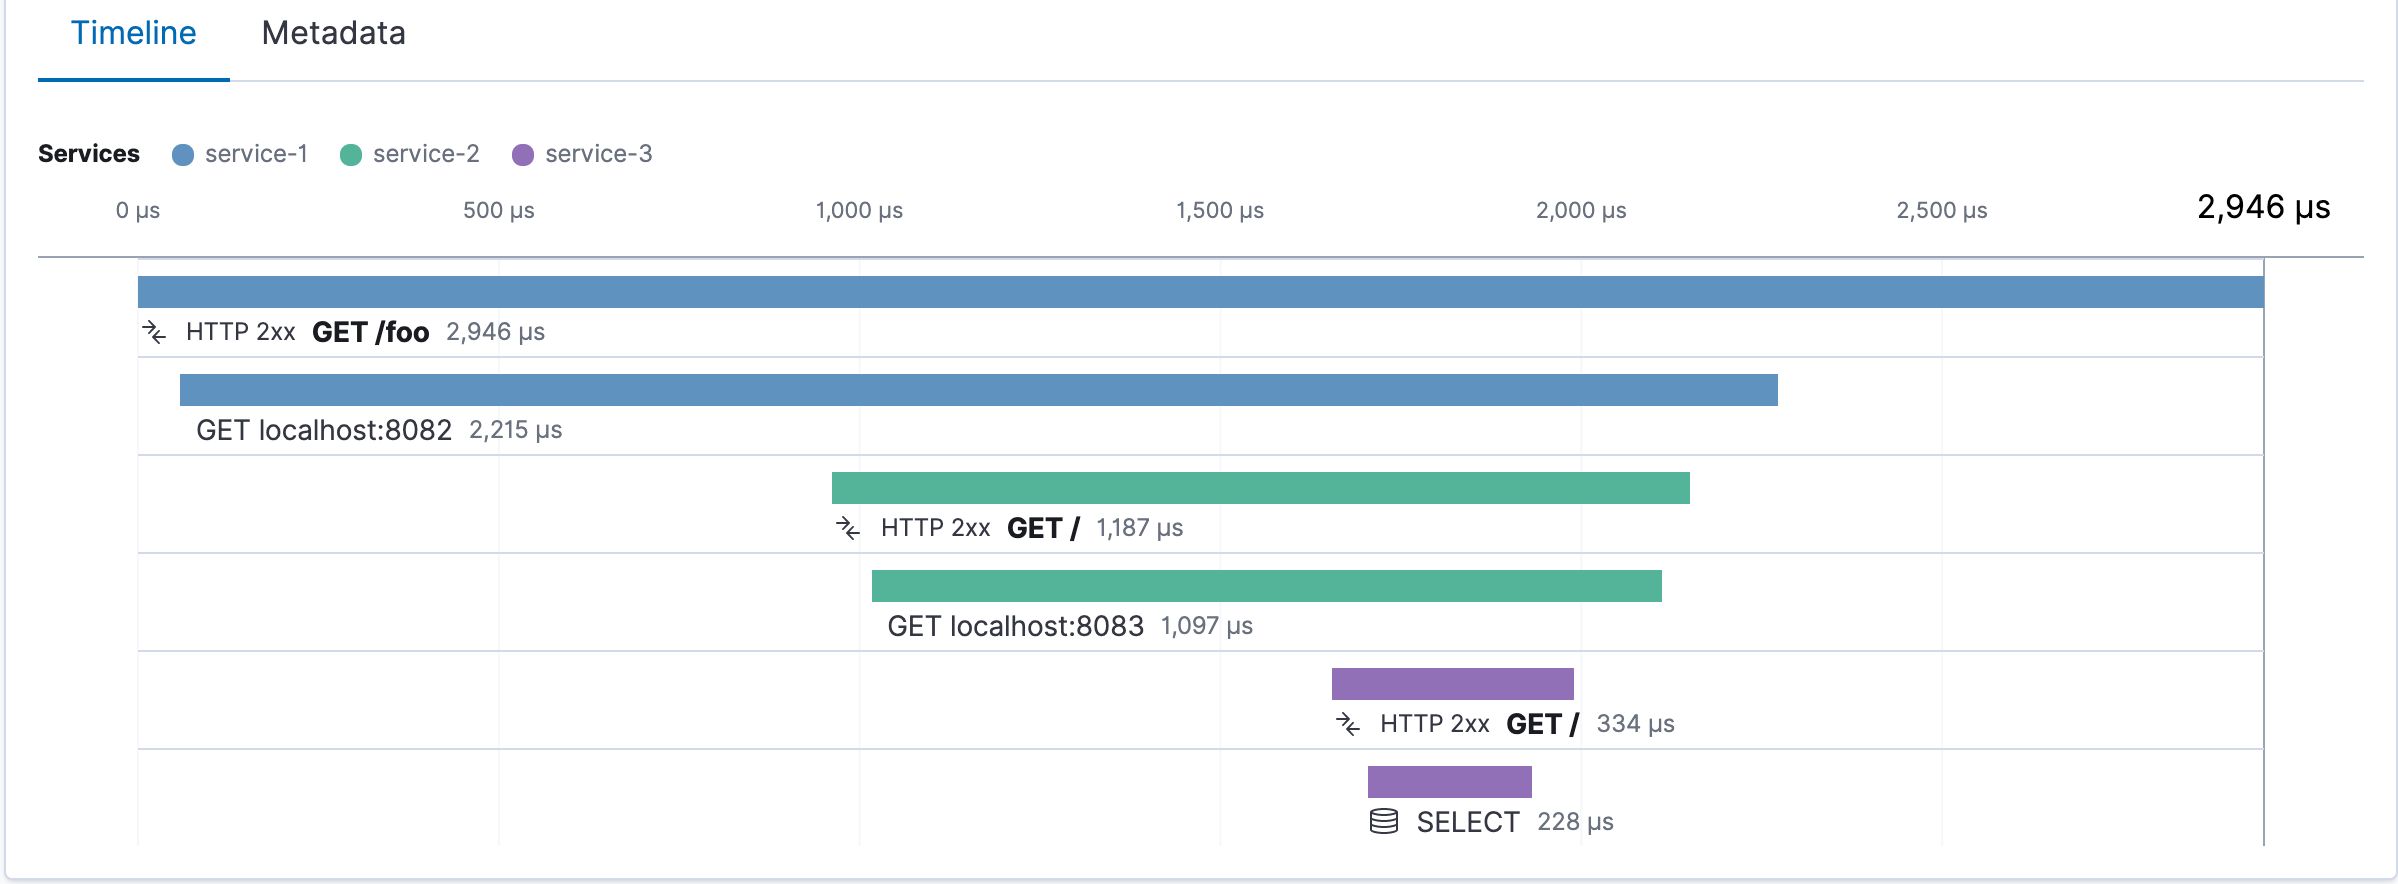
Hey fellow code warriors! If you're like me, you've probably spent countless nights debugging production issues, chugging energy drinks, and questioning your life choices. Well, buckle up, because we're diving deep into the world of Application Performance Monitoring (APM) tools - your new best friends in the battle against 3 AM alerts and angry users. APM Tools: Your Digital Swiss Army Knife Imagine having a magical pair of X-ray goggles that let you see through the tangled mess of your production environment. That's essentially what APM tools do. They help you monitor, diagnose, and optimize your application's performance in real-time. And trust me, when you're trying to figure out why your microservices decided to have an existential crisis during peak traffic, you'll be glad you have these in your arsenal. Here's why you should give a damn: Real-time monitoring: Catch issues before your users start roasting you on Twitter. End-user experience: Understand how your app performs from the user's perspective (spoiler: it's probably slower than you think). Root cause analysis: Quickly pinpoint the source of performance problems, because playing 'whack-a-mole' with bugs is so last decade. Capacity planning: Make data-driven decisions about scaling your infrastructure, instead of panic-buying servers every time traffic spikes. The Secret Sauce: Key Features of Kick-Ass APM Solutions After years of trial and error (mostly error), here are the features I've found most valuable: Distributed tracing: Essential for understanding request flows in microservices architectures. Because let's face it, your "simple" app probably looks like a plate of spaghetti under the hood. Alerting and notifications: Get notified about issues before they become critical. Your phone buzzing at 2 AM might not be ideal, but it's better than waking up to 1000 angry customer emails. Customizable dashboards: Tailor your view to focus on what matters most. Yes, error rates are important, but so is that custom metric tracking how many cat GIFs your app serves per second. Code-level insights: Identify performance bottlenecks down to specific lines of code. It's like having a really judgmental code review, but helpful. Scalability: Your APM should grow with your application. Because your side project might be the next unicorn, right? The Showdown: Popular APM Tools Compared Alright, let's get to the juicy part. Here's a no-BS comparison of some popular APM tools I've wrestled with: Feature New Relic Datadog Dynatrace Elastic APM Jaeger Last9 Ease of Setup 🟢🟢🟢🟢 🟢🟢🟢🟢 🟢🟢🟢 🟢🟢🟢 🟢🟢 🟢🟢🟢🟢 UI Friendliness 🟢🟢🟢🟢🟢 🟢🟢🟢🟢 🟢🟢🟢 🟢🟢🟢 🟢🟢 🟢🟢🟢🟢 Distributed Tracing 🟢🟢🟢🟢 🟢🟢🟢🟢🟢 🟢🟢🟢🟢🟢 🟢🟢🟢 🟢🟢🟢🟢🟢 🟢🟢🟢🟢 AI-Powered Insights 🟢🟢🟢 🟢🟢🟢🟢 🟢🟢🟢🟢🟢 🟢🟢 🟢 🟢🟢 Cloud-Native Support 🟢🟢🟢🟢 🟢🟢🟢🟢🟢 🟢🟢🟢🟢 🟢🟢🟢 🟢🟢🟢 🟢🟢🟢🟢🟢 Customization 🟢🟢🟢🟢 🟢🟢🟢🟢🟢 🟢🟢🟢 🟢🟢🟢🟢 🟢🟢🟢 🟢🟢🟢🟢🟢 Cost (💰 = $$$) 💰💰💰💰 💰💰💰💰 💰💰💰💰💰 💰💰💰 💰 (Open Source) 💰💰💰 Remember, the "best" tool depends on your specific needs, budget, and how much you enjoy yelling at vendor support. Choose wisely, young padawan. Implementing APM: Because "It Works on My Machine" Doesn't Cut It Anymore Integrating APM into your workflow is crucial. Here's how I approach it, and trust me, I've learned these lessons the hard way: Start early: Implement APM in your development environment. Catching performance issues early is like flossing - it sucks, but it saves you pain later. CI/CD integration: Include performance checks in your pipelines. Make your CI/CD pipeline reject underperforming code faster than you swipe left on dating apps. Establish baselines: Know what "normal" looks like for your app. Is 100ms response time good? Bad? Depends on whether you're serving cat GIFs or processing credit card transactions. Continuous monitoring: Don't just set it and forget it; regularly review and adjust. Treat your APM setup like your code - it needs constant love and refactoring. Chaos engineering: Intentionally break things in production (carefully!) to test your monitoring and alerting. It's like a fire drill, but with more cursing and caffeine. Best Practices: Or "How I Learned to Stop Worrying and Love the Metrics" Set meaningful alerts: Don't alert on everything; focus on what truly impacts your users. Your pager duty shouldn't go off because CPU spiked to 82.1% for 3 seconds at 3 AM. Use custom instrumentation: Add context-specific metrics for your business logic. Sure, server response time is important, but so is "time to first cat GIF". Correlate metrics: Look at the bigger picture by connecting different data points. High CPU + High Memory + Low Disk I/O might mean your app is crypto mining (or just badly optimized). Regular review sessions: Schedule time to analyze trends and plan optimizations. Make it a team bonding activity. Nothing brings people together like shared performance graphs and pizza. Train your team: Ensure everyone knows how to use the APM tools effectively. It's like teaching everyone to fish, but instead of fish, it's debugging production issues. APM for Microservices: Because One Service Is Never Enough Microservices are like potato chips - you can't have just one. Here's how to deal with the complexity: Distributed tracing is key: Use tools that can trace requests across multiple services. It's like following a trail of breadcrumbs, but the breadcrumbs are log entries and the forest is your production environment. Service maps: Visualize dependencies between your microservices. It's like those conspiracy theory boards with red strings, but it actually makes sense. Consistent naming conventions: Make it easy to identify services and endpoints. "auth-svc-v2-final-final-for-real-this-time" is not a good service name. Correlation IDs: Implement correlation IDs across your services. It's like putting a GPS tracker on each request - creepy, but effective. Standardize your stack: Use consistent libraries and patterns across services. It's tempting to use a different language for each service, but your future self (and your teammates) will thank you for some consistency. Conclusion: May Your Servers Be Stable and Your Latency Low APM tools are like a good therapist for your application - they help you understand its problems, work through its issues, and ultimately, make it perform better under stress. By implementing APM early, integrating it into your development lifecycle, and following these best practices, you can catch issues early, optimize performance, and deliver a better experience to your users. Plus, you might actually get to sleep through the night without your phone buzzing with alerts. Remember, the journey to APM mastery is ongoing. Keep learning, experimenting, and refining your approach. And when in doubt, blame the network. Now go forth and monitor like a boss! May your graphs always trend upward (except for those latency ones - those should definitely trend downward). Happy monitoring, and may the performance be with you! Hey fellow code warriors! If you're like me, you've probably spent countless nights debugging production issues, chugging energy drinks, and questioning your life choices. Well, buckle up, because we're diving deep into the world of Application Performance Monitoring (APM) tools - your new best friends in the battle against 3 AM alerts and angry users. Application Performance Monitoring (APM) tools APM Tools: Your Digital Swiss Army Knife Imagine having a magical pair of X-ray goggles that let you see through the tangled mess of your production environment. That's essentially what APM tools do. They help you monitor, diagnose, and optimize your application's performance in real-time. And trust me, when you're trying to figure out why your microservices decided to have an existential crisis during peak traffic, you'll be glad you have these in your arsenal. Here's why you should give a damn: Real-time monitoring: Catch issues before your users start roasting you on Twitter. End-user experience: Understand how your app performs from the user's perspective (spoiler: it's probably slower than you think). Root cause analysis: Quickly pinpoint the source of performance problems, because playing 'whack-a-mole' with bugs is so last decade. Capacity planning: Make data-driven decisions about scaling your infrastructure, instead of panic-buying servers every time traffic spikes. Real-time monitoring : Catch issues before your users start roasting you on Twitter. Real-time monitoring End-user experience : Understand how your app performs from the user's perspective (spoiler: it's probably slower than you think). End-user experience Root cause analysis : Quickly pinpoint the source of performance problems, because playing 'whack-a-mole' with bugs is so last decade. Root cause analysis Capacity planning : Make data-driven decisions about scaling your infrastructure, instead of panic-buying servers every time traffic spikes. Capacity planning The Secret Sauce: Key Features of Kick-Ass APM Solutions After years of trial and error (mostly error), here are the features I've found most valuable: Distributed tracing: Essential for understanding request flows in microservices architectures. Because let's face it, your "simple" app probably looks like a plate of spaghetti under the hood. Alerting and notifications: Get notified about issues before they become critical. Your phone buzzing at 2 AM might not be ideal, but it's better than waking up to 1000 angry customer emails. Customizable dashboards: Tailor your view to focus on what matters most. Yes, error rates are important, but so is that custom metric tracking how many cat GIFs your app serves per second. Code-level insights: Identify performance bottlenecks down to specific lines of code. It's like having a really judgmental code review, but helpful. Scalability: Your APM should grow with your application. Because your side project might be the next unicorn, right? Distributed tracing : Essential for understanding request flows in microservices architectures. Because let's face it, your "simple" app probably looks like a plate of spaghetti under the hood. Distributed tracing Alerting and notifications : Get notified about issues before they become critical. Your phone buzzing at 2 AM might not be ideal, but it's better than waking up to 1000 angry customer emails. Alerting and notifications Customizable dashboards : Tailor your view to focus on what matters most. Yes, error rates are important, but so is that custom metric tracking how many cat GIFs your app serves per second. Customizable dashboards Code-level insights : Identify performance bottlenecks down to specific lines of code. It's like having a really judgmental code review, but helpful. Code-level insights Scalability : Your APM should grow with your application. Because your side project might be the next unicorn, right? Scalability The Showdown: Popular APM Tools Compared Alright, let's get to the juicy part. Here's a no-BS comparison of some popular APM tools I've wrestled with: Feature New Relic Datadog Dynatrace Elastic APM Jaeger Last9 Ease of Setup 🟢🟢🟢🟢 🟢🟢🟢🟢 🟢🟢🟢 🟢🟢🟢 🟢🟢 🟢🟢🟢🟢 UI Friendliness 🟢🟢🟢🟢🟢 🟢🟢🟢🟢 🟢🟢🟢 🟢🟢🟢 🟢🟢 🟢🟢🟢🟢 Distributed Tracing 🟢🟢🟢🟢 🟢🟢🟢🟢🟢 🟢🟢🟢🟢🟢 🟢🟢🟢 🟢🟢🟢🟢🟢 🟢🟢🟢🟢 AI-Powered Insights 🟢🟢🟢 🟢🟢🟢🟢 🟢🟢🟢🟢🟢 🟢🟢 🟢 🟢🟢 Cloud-Native Support 🟢🟢🟢🟢 🟢🟢🟢🟢🟢 🟢🟢🟢🟢 🟢🟢🟢 🟢🟢🟢 🟢🟢🟢🟢🟢 Customization 🟢🟢🟢🟢 🟢🟢🟢🟢🟢 🟢🟢🟢 🟢🟢🟢🟢 🟢🟢🟢 🟢🟢🟢🟢🟢 Cost (💰 = $$$) 💰💰💰💰 💰💰💰💰 💰💰💰💰💰 💰💰💰 💰 (Open Source) 💰💰💰 Feature New Relic Datadog Dynatrace Elastic APM Jaeger Last9 Ease of Setup 🟢🟢🟢🟢 🟢🟢🟢🟢 🟢🟢🟢 🟢🟢🟢 🟢🟢 🟢🟢🟢🟢 UI Friendliness 🟢🟢🟢🟢🟢 🟢🟢🟢🟢 🟢🟢🟢 🟢🟢🟢 🟢🟢 🟢🟢🟢🟢 Distributed Tracing 🟢🟢🟢🟢 🟢🟢🟢🟢🟢 🟢🟢🟢🟢🟢 🟢🟢🟢 🟢🟢🟢🟢🟢 🟢🟢🟢🟢 AI-Powered Insights 🟢🟢🟢 🟢🟢🟢🟢 🟢🟢🟢🟢🟢 🟢🟢 🟢 🟢🟢 Cloud-Native Support 🟢🟢🟢🟢 🟢🟢🟢🟢🟢 🟢🟢🟢🟢 🟢🟢🟢 🟢🟢🟢 🟢🟢🟢🟢🟢 Customization 🟢🟢🟢🟢 🟢🟢🟢🟢🟢 🟢🟢🟢 🟢🟢🟢🟢 🟢🟢🟢 🟢🟢🟢🟢🟢 Cost (💰 = $$$) 💰💰💰💰 💰💰💰💰 💰💰💰💰💰 💰💰💰 💰 (Open Source) 💰💰💰 Feature New Relic Datadog Dynatrace Elastic APM Jaeger Last9 Feature Feature New Relic New Relic Datadog Datadog Dynatrace Dynatrace Elastic APM Elastic APM Jaeger Jaeger Last9 Last9 Ease of Setup 🟢🟢🟢🟢 🟢🟢🟢🟢 🟢🟢🟢 🟢🟢🟢 🟢🟢 🟢🟢🟢🟢 Ease of Setup Ease of Setup 🟢🟢🟢🟢 🟢🟢🟢🟢 🟢🟢🟢🟢 🟢🟢🟢🟢 🟢🟢🟢 🟢🟢🟢 🟢🟢🟢 🟢🟢🟢 🟢🟢 🟢🟢 🟢🟢🟢🟢 🟢🟢🟢🟢 UI Friendliness 🟢🟢🟢🟢🟢 🟢🟢🟢🟢 🟢🟢🟢 🟢🟢🟢 🟢🟢 🟢🟢🟢🟢 UI Friendliness UI Friendliness 🟢🟢🟢🟢🟢 🟢🟢🟢🟢🟢 🟢🟢🟢🟢 🟢🟢🟢🟢 🟢🟢🟢 🟢🟢🟢 🟢🟢🟢 🟢🟢🟢 🟢🟢 🟢🟢 🟢🟢🟢🟢 🟢🟢🟢🟢 Distributed Tracing 🟢🟢🟢🟢 🟢🟢🟢🟢🟢 🟢🟢🟢🟢🟢 🟢🟢🟢 🟢🟢🟢🟢🟢 🟢🟢🟢🟢 Distributed Tracing Distributed Tracing 🟢🟢🟢🟢 🟢🟢🟢🟢 🟢🟢🟢🟢🟢 🟢🟢🟢🟢🟢 🟢🟢🟢🟢🟢 🟢🟢🟢🟢🟢 🟢🟢🟢 🟢🟢🟢 🟢🟢🟢🟢🟢 🟢🟢🟢🟢🟢 🟢🟢🟢🟢 🟢🟢🟢🟢 AI-Powered Insights 🟢🟢🟢 🟢🟢🟢🟢 🟢🟢🟢🟢🟢 🟢🟢 🟢 🟢🟢 AI-Powered Insights AI-Powered Insights 🟢🟢🟢 🟢🟢🟢 🟢🟢🟢🟢 🟢🟢🟢🟢 🟢🟢🟢🟢🟢 🟢🟢🟢🟢🟢 🟢🟢 🟢🟢 🟢 🟢 🟢🟢 🟢🟢 Cloud-Native Support 🟢🟢🟢🟢 🟢🟢🟢🟢🟢 🟢🟢🟢🟢 🟢🟢🟢 🟢🟢🟢 🟢🟢🟢🟢🟢 Cloud-Native Support Cloud-Native Support 🟢🟢🟢🟢 🟢🟢🟢🟢 🟢🟢🟢🟢🟢 🟢🟢🟢🟢🟢 🟢🟢🟢🟢 🟢🟢🟢🟢 🟢🟢🟢 🟢🟢🟢 🟢🟢🟢 🟢🟢🟢 🟢🟢🟢🟢🟢 🟢🟢🟢🟢🟢 Customization 🟢🟢🟢🟢 🟢🟢🟢🟢🟢 🟢🟢🟢 🟢🟢🟢🟢 🟢🟢🟢 🟢🟢🟢🟢🟢 Customization Customization 🟢🟢🟢🟢 🟢🟢🟢🟢 🟢🟢🟢🟢🟢 🟢🟢🟢🟢🟢 🟢🟢🟢 🟢🟢🟢 🟢🟢🟢🟢 🟢🟢🟢🟢 🟢🟢🟢 🟢🟢🟢 🟢🟢🟢🟢🟢 🟢🟢🟢🟢🟢 Cost (💰 = $$$) 💰💰💰💰 💰💰💰💰 💰💰💰💰💰 💰💰💰 💰 (Open Source) 💰💰💰 Cost (💰 = $$$) Cost (💰 = $$$) 💰💰💰💰 💰💰💰💰 💰💰💰💰 💰💰💰💰 💰💰💰💰💰 💰💰💰💰💰 💰💰💰 💰💰💰 💰 (Open Source) 💰 (Open Source) 💰💰💰 💰💰💰 Remember, the "best" tool depends on your specific needs, budget, and how much you enjoy yelling at vendor support. Choose wisely, young padawan. Implementing APM: Because "It Works on My Machine" Doesn't Cut It Anymore Integrating APM into your workflow is crucial. Here's how I approach it, and trust me, I've learned these lessons the hard way: Start early: Implement APM in your development environment. Catching performance issues early is like flossing - it sucks, but it saves you pain later. CI/CD integration: Include performance checks in your pipelines. Make your CI/CD pipeline reject underperforming code faster than you swipe left on dating apps. Establish baselines: Know what "normal" looks like for your app. Is 100ms response time good? Bad? Depends on whether you're serving cat GIFs or processing credit card transactions. Continuous monitoring: Don't just set it and forget it; regularly review and adjust. Treat your APM setup like your code - it needs constant love and refactoring. Chaos engineering: Intentionally break things in production (carefully!) to test your monitoring and alerting. It's like a fire drill, but with more cursing and caffeine. Start early : Implement APM in your development environment. Catching performance issues early is like flossing - it sucks, but it saves you pain later. Start early CI/CD integration : Include performance checks in your pipelines. Make your CI/CD pipeline reject underperforming code faster than you swipe left on dating apps. CI/CD integration Establish baselines : Know what "normal" looks like for your app. Is 100ms response time good? Bad? Depends on whether you're serving cat GIFs or processing credit card transactions. Establish baselines Continuous monitoring : Don't just set it and forget it; regularly review and adjust. Treat your APM setup like your code - it needs constant love and refactoring. Continuous monitoring Chaos engineering : Intentionally break things in production (carefully!) to test your monitoring and alerting. It's like a fire drill, but with more cursing and caffeine. Chaos engineering Best Practices: Or "How I Learned to Stop Worrying and Love the Metrics" Set meaningful alerts: Don't alert on everything; focus on what truly impacts your users. Your pager duty shouldn't go off because CPU spiked to 82.1% for 3 seconds at 3 AM. Use custom instrumentation: Add context-specific metrics for your business logic. Sure, server response time is important, but so is "time to first cat GIF". Correlate metrics: Look at the bigger picture by connecting different data points. High CPU + High Memory + Low Disk I/O might mean your app is crypto mining (or just badly optimized). Regular review sessions: Schedule time to analyze trends and plan optimizations. Make it a team bonding activity. Nothing brings people together like shared performance graphs and pizza. Train your team: Ensure everyone knows how to use the APM tools effectively. It's like teaching everyone to fish, but instead of fish, it's debugging production issues. Set meaningful alerts : Don't alert on everything; focus on what truly impacts your users. Your pager duty shouldn't go off because CPU spiked to 82.1% for 3 seconds at 3 AM. Set meaningful alerts Use custom instrumentation : Add context-specific metrics for your business logic. Sure, server response time is important, but so is "time to first cat GIF". Use custom instrumentation Correlate metrics : Look at the bigger picture by connecting different data points. High CPU + High Memory + Low Disk I/O might mean your app is crypto mining (or just badly optimized). Correlate metrics Regular review sessions : Schedule time to analyze trends and plan optimizations. Make it a team bonding activity. Nothing brings people together like shared performance graphs and pizza. Regular review sessions Train your team : Ensure everyone knows how to use the APM tools effectively. It's like teaching everyone to fish, but instead of fish, it's debugging production issues. Train your team APM for Microservices: Because One Service Is Never Enough Microservices are like potato chips - you can't have just one. Here's how to deal with the complexity: Distributed tracing is key: Use tools that can trace requests across multiple services. It's like following a trail of breadcrumbs, but the breadcrumbs are log entries and the forest is your production environment. Service maps: Visualize dependencies between your microservices. It's like those conspiracy theory boards with red strings, but it actually makes sense. Consistent naming conventions: Make it easy to identify services and endpoints. "auth-svc-v2-final-final-for-real-this-time" is not a good service name. Correlation IDs: Implement correlation IDs across your services. It's like putting a GPS tracker on each request - creepy, but effective. Standardize your stack: Use consistent libraries and patterns across services. It's tempting to use a different language for each service, but your future self (and your teammates) will thank you for some consistency. Distributed tracing is key : Use tools that can trace requests across multiple services. It's like following a trail of breadcrumbs, but the breadcrumbs are log entries and the forest is your production environment. Distributed tracing is key Service maps : Visualize dependencies between your microservices. It's like those conspiracy theory boards with red strings, but it actually makes sense. Service maps Consistent naming conventions : Make it easy to identify services and endpoints. "auth-svc-v2-final-final-for-real-this-time" is not a good service name. Consistent naming conventions Correlation IDs : Implement correlation IDs across your services. It's like putting a GPS tracker on each request - creepy, but effective. Correlation IDs Standardize your stack : Use consistent libraries and patterns across services. It's tempting to use a different language for each service, but your future self (and your teammates) will thank you for some consistency. Standardize your stack Conclusion: May Your Servers Be Stable and Your Latency Low APM tools are like a good therapist for your application - they help you understand its problems, work through its issues, and ultimately, make it perform better under stress. By implementing APM early, integrating it into your development lifecycle, and following these best practices, you can catch issues early, optimize performance, and deliver a better experience to your users. Plus, you might actually get to sleep through the night without your phone buzzing with alerts. Remember, the journey to APM mastery is ongoing. Keep learning, experimenting, and refining your approach. And when in doubt, blame the network. Now go forth and monitor like a boss! May your graphs always trend upward (except for those latency ones - those should definitely trend downward). Happy monitoring, and may the performance be with you!