paint-brush

This story draft by @largemodels has not been reviewed by an editor, YET.

Supplementary Figures and Supplementary Tables

featured image - Supplementary Figures and Supplementary Tables
Large Models HackerNoon profile picture
0-item

Table of Links

  1. Abstract and Introduction
  2. SylloBio-NLI
  3. Empirical Evaluation
  4. Related Work
  5. Conclusions
  6. Limitations and References


A. Formalization of the SylloBio-NLI Resource Generation Process

B. Formalization of Tasks 1 and 2

C. Dictionary of gene and pathway membership

D. Domain-specific pipeline for creating NL instances and E Accessing LLMs

F. Experimental Details

G. Evaluation Metrics

H. Prompting LLMs - Zero-shot prompts

I. Prompting LLMs - Few-shot prompts

J. Results: Misaligned Instruction-Response

K. Results: Ambiguous Impact of Distractors on Reasoning

L. Results: Models Prioritize Contextual Knowledge Over Background Knowledge

M Supplementary Figures and N Supplementary Tables

M Supplementary Figures

N Supplementary Tables

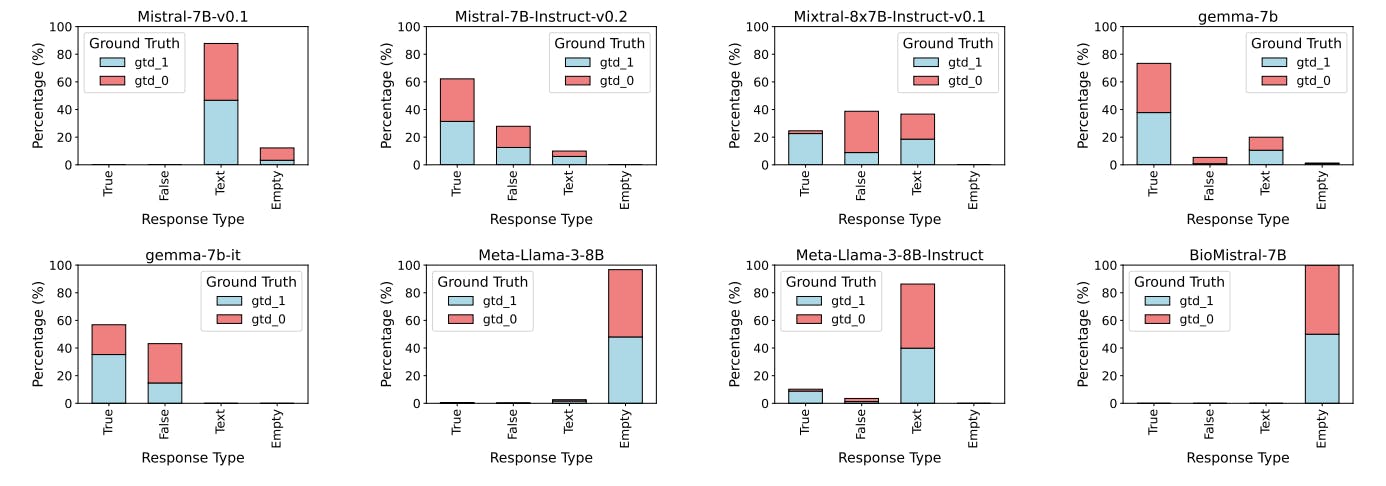
Figure 9: Percentage distribution of model response types under few-shot settings for prompts with no distractors for the set of biologically factual argumentative texts.


Figure 10: Percentage distribution of model response types under zero-shot settings for prompts with all distractors for the set of biologically factual argumentative texts.


Figure 11: Percentage distribution of model response types under few-shot settings for prompts with all distractors for the set of biologically factual argumentative texts.


Figure 12: Task 1: Accuracy versus number of distractors and scheme in the zero-shot setting. Lines connect the average values for each model, with error bars representing the range (min-max).


Figure 13: Task 1: Accuracy versus number of distractors and scheme in the few-shot setting. Lines connect the average values for each model, with error bars representing the range (min-max).


Figure 14: Task 2: Reasoning accuracy versus number of distractors and scheme in the zero-shot setting. Lines connect the average values for each model, with error bars representing the range (min-max).


Table 4: Task 1: Distribution of model response types and performance outcomes across two experimental settings—ZS and FS, considering all distractor conditions (n distractors from 0 to 5), for all syllogistic schemes within biologically factual argumentative texts. Response types include: non-empty outputs, irrelevant text generation, and outputs adhering to the given instructions.


Figure 15: Task 2: Reasoning accuracy versus number of distractors and scheme in the few-shot setting. Lines connect the average values for each model, with error bars representing the range (min-max).


Table 5: Results from Task 1 baseline models on the biologically factual argumentative texts set (without synthetic data and without distractors, bold - the best and worst accuracy values for each model).


Table 6: Values of the Spearman’s Ranked Correlation Coefficient (r) for Accuracy by Distractors and Syllogistic Scheme for evaluated Models in Task 1: Spearman’s correlation coefficients (r) and p-values for the accuracy metric are shown across various levels of distractors and syllogistic schemes for each model. Negative r values reflect a decrease in accuracy with increasing distractor complexity. The highest correlation values for each scheme are highlighted in bold, indicating the models most affected by distractors.


Table 7: Reasoning accuracy results from Task 2 baseline models on the set of biologically factual argumentative texts (without synthetic data and without distractors).


Table 8: Values of the Spearman’s Ranked Correlation Coefficient (r) for Accuracy by Distractors and Syllogistic Scheme for evaluated Models in Task 2: Spearman’s correlation coefficients (r) and p-values for the reasoning accuracy metric are shown across various levels of distractors and syllogistic schemes for each model. Negative r values reflect a decrease in accuracy with increasing distractor complexity. The highest correlation values for each scheme are highlighted in bold, indicating the models most affected by distractors.


Authors:

(1) Magdalena Wysocka, National Biomarker Centre, CRUK-MI, Univ. of Manchester, United Kingdom;

(2) Danilo S. Carvalho, National Biomarker Centre, CRUK-MI, Univ. of Manchester, United Kingdom and Department of Computer Science, Univ. of Manchester, United Kingdom;

(3) Oskar Wysocki, National Biomarker Centre, CRUK-MI, Univ. of Manchester, United Kingdom and ited Kingdom 3 I;

(4) Marco Valentino, Idiap Research Institute, Switzerland;

(5) André Freitas, National Biomarker Centre, CRUK-MI, Univ. of Manchester, United Kingdom, Department of Computer Science, Univ. of Manchester, United Kingdom and Idiap Research Institute, Switzerland.


This paper is available on arxiv under CC BY-NC-SA 4.0 license.