Google Analytics 4 (GA4) for Beginners—Part 3: Mastering Data Filters, Comparisons, and Explorations by@ashumerie

156 reads
Google Analytics 4 (GA4) for Beginners—Part 3: Mastering Data Filters, Comparisons, and Explorations
by Asher May 15th, 2024


Too Long; Didn't Read
This guide covers how to filter and compare reports in Google Analytics 4, and introduces advanced exploration techniques such as funnels and cohorts to analyze user behavior.


Welcome to Part 3 of the GA4 for Beginners series.
So far, we’ve looked at:
- how GA4 collects and processes data,
- the basic structure of a GA4 account,
- the role of Dimensions & metrics in GA4,
- the GA4 user interface,
- reports and how to gain insights from them.
If any of these seem foreign to you, take a few minutes to review the first two parts of this series:
In this part, we’ll learn how to filter and compare reports. We’ll also look at some advanced exploration techniques for analyzing user behavior, like funnels, cohorts, and so forth.
How to Filter and Compare Reports in Google Analytics 4
In the first part of this series, we discussed how GA4 collects and processes your business data.
First, GA4 connects to your website with the help of a tag—a small piece of Javascript code added to each page of your website to measure user activity. Once the tag is added, GA4 collects user interactions in the form of events. These events are then compiled into useful reports that are made up of dimensions and metrics.
Dimensions are text descriptions of your data, while metrics are quantitative measurements. An example of a dimension is the name of an event. From our example, the dimension would be “page_view.” The metric would be the number of page views recorded over a selected period.
Not all reports in GA4 are created equally. The dimensions and metrics with which they're compiled can vary. Some are automatically populated, while others require a little configuration.
This is where Report Filters come in.
GA4 Report Filters
Using dimension values, report filters allow you to visualize a subset of your data for a more granular understanding of user behavior.
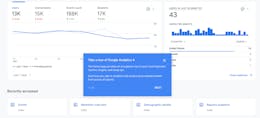
Let’s see what Report Filters look like with this User Acquisition Report:
On your user acquisition reports page, click the “add filter” button at the top left corner, as shown in the image below.


A fly-out menu, where you can ‘build your filter,’ will appear on the right side of your screen. There, you’ll need to fill in up to 5 conditions. When selecting a dimension to filter, only dimensions with values will appear on the list. Also, only dimensions compatible with the dimensions on your current report can be filtered.
In the image below, my dimension value is “First session date.” This means I wanted to filter the data displayed using a specific date. But that’s not all. Next, I select “contains” as my match type and, finally, “2023” as my dimension value. That’s it! We’ve built a filter that will show us data from the specified timeframe of users who had their first-ever session in 2023.


A filter like this can help a business understand how many users are revisiting the website months & even years later. And with further investigation, business stakeholders can find out why users are coming back or dropping off.
Comparing GA4 Reports
Some people say comparison is the thief of joy. Great saying. It instructs us to embrace contentment and live in gratitude for what we hold in our hands. However, the opposite is true in the world of analytics. They allow you to analyze subsets of your data side-by-side. This lets you observe patterns & draw valuable information on how the users on your website behave.
**Let’s say I want to compare the organic traffic a website is receiving from 2 different countries—the United States & India.
-
First, I clicked on the “add comparison” button at the top left corner of the screen. After this, I got a list of dimensions that can be compared for the report in the question.
-
Then, I selected “organic traffic.”


- Next, I clicked on the “create new” button, and a new conditions menu appeared just like with report filters. I selected “country,” “exactly matches,” & “United States.” Then, I hit apply.


- Next, I repeated the same process for India.
- The result is two color-coded data sets comparing Organic traffic from both countries.


This information would be invaluable for organizing your marketing efforts if you run an eCommerce website. From the image above, if you had a marketing budget that needs to be split between the U.S. and India, the U.S. would take the lion's share because many more users are finding you from that region. Easy enough, isn’t it?
Now, let’s take a look at the GA4 Explore Section.
How to Use Explore in GA4
The Explore section in GA4 is another useful tool for deeper user data analysis. Let’s explore it. (See what I did there?)


The Explore section, found in your main navigation panel on the left, houses a collection of advanced analytics techniques that provide more insights about user behavior.
The reports you can build within the explore section are called Explorations. As you can see in the image above, you can build explorations from scratch or with any of the preset templates.
Let’s have a look at them:


GA4 comes with the following preset techniques for building Explorations:
-
Free form: This technique gives you the freedom to explore your data with several visualization styles—bar charts, pie charts, line charts, scatter plots, geo maps, and, of course, tables.
-
Funnel exploration: This technique gives you an idea of the steps users take to complete a specific task on your website or mobile app.
-
Path exploration: This helps you learn about paths users take as they interact with your website. Let’s say two different users purchase an item from an e-commerce site. One user used a link that was shared with them by another user and headed straight to the “buy” button. The second user started from the homepage, explored various categories, and eventually settled on the item of choice before hitting the “buy” button. Same action, two different paths.
-
Segment overlap: This shows you how different groups of users or user segments relate to each other.
-
Cohort exploration: This helps you understand the behavior and performance of different but related groups of users and the common attributes they share.
-
User lifetime: This technique should sound familiar. It helps you understand how users behave from the first moment they find your website or mobile app and for as long as they interact with it.
Now, let’s put one of these techniques to the test.
Funnel Explorations in GA4
As mentioned earlier, funnels help you understand the steps taken by users to complete a specific task.


Sticking with our eCommerce website example, let’s look at a preset funnel that shows how users, from a given timeframe, progressed from “first visit” to a purchase.
In the image above, encased in orange, is the Variables panel. This gives you access to the segments, dimensions, and metrics you can use in an exploration. Encased in black is the timeframe toggle for choosing your desired timeframe. Right above it, you can give your exploration a name.
Next, encased in green borders, is the tab settings panel. This panel determines what you can see on the large canvas on the right.
Summarily, you load up your desired segments, dimensions & metrics in the variables panel, configure their interaction with each other in the tab settings, and observe your exploration on the canvas.
Gbam (That’s it)!
In this guide, we’ve:
- Discussed how to filter & compare GA4 reports.
- Toured the GA4 explore section.
- Different exploration techniques and the kind of insights they provide.
- A sample funnel exploration and the components used to build it.
Take some time to play around with different explorations. If you run into any problems, I’m happy to discuss them with you!
In the next guide, we’ll take a look at how GA4 can help you optimize your marketing efforts.
To ensure you don’t miss any updates,
See you soon!

L O A D I N G
. . . comments & more!
. . . comments & more!