


5,365 reads
A Guide to Local Debugging with Datadog Agent
by Dhivya DandapaniMarch 21st, 2023


Too Long; Didn't Read
The Datadog tool is used to visualize production logs. It can be installed on a MacOSX machine. The tool is written in Java and can be used to monitor Java applications. It is free and available for free on the company's website. The instructions below are for the local installation.


Let’s start with “why” should one even bother with setting up Datadog on the local machine. I can share my motivation to set it up
My strong ‘why’:trying to make sense of the flaky tests:
We had an extensive end-to-end test suite with high coverage. But sadly, the tests grew flakier and flakier over time. To my dismay, when the tests were run in isolation, they’d pass. When we ran the entire test suite, many tests would start failing. The application logs corresponding to the tests should help us debug. But I couldn’t even understand where the logs for a particular test started and ended, let alone make sense of them.
Datadog to the rescue 🦸!
We have been using
Our application is written in Java and my local machine runs on MacOS. You could tweak the below steps to suit your need.
What do you need to set up:


- Sign up for Datadog
here . Our scope here is only local debugging, so afree trial should suffice. - Datadog Agent is the software that monitors the host on which it runs. Settings like service name, environment, etc. can be made in the agent.
dd-trace-java , Datadog's APM (App Performance Monitoring) client Java library.dd-trace-javais a jar that contains APIs to automatically or manuallytrace andprofile Java applications.
Step 1 — Sign up process:
-
After giving your email id and other details, you would be prompted to choose your tech stack on the next page.
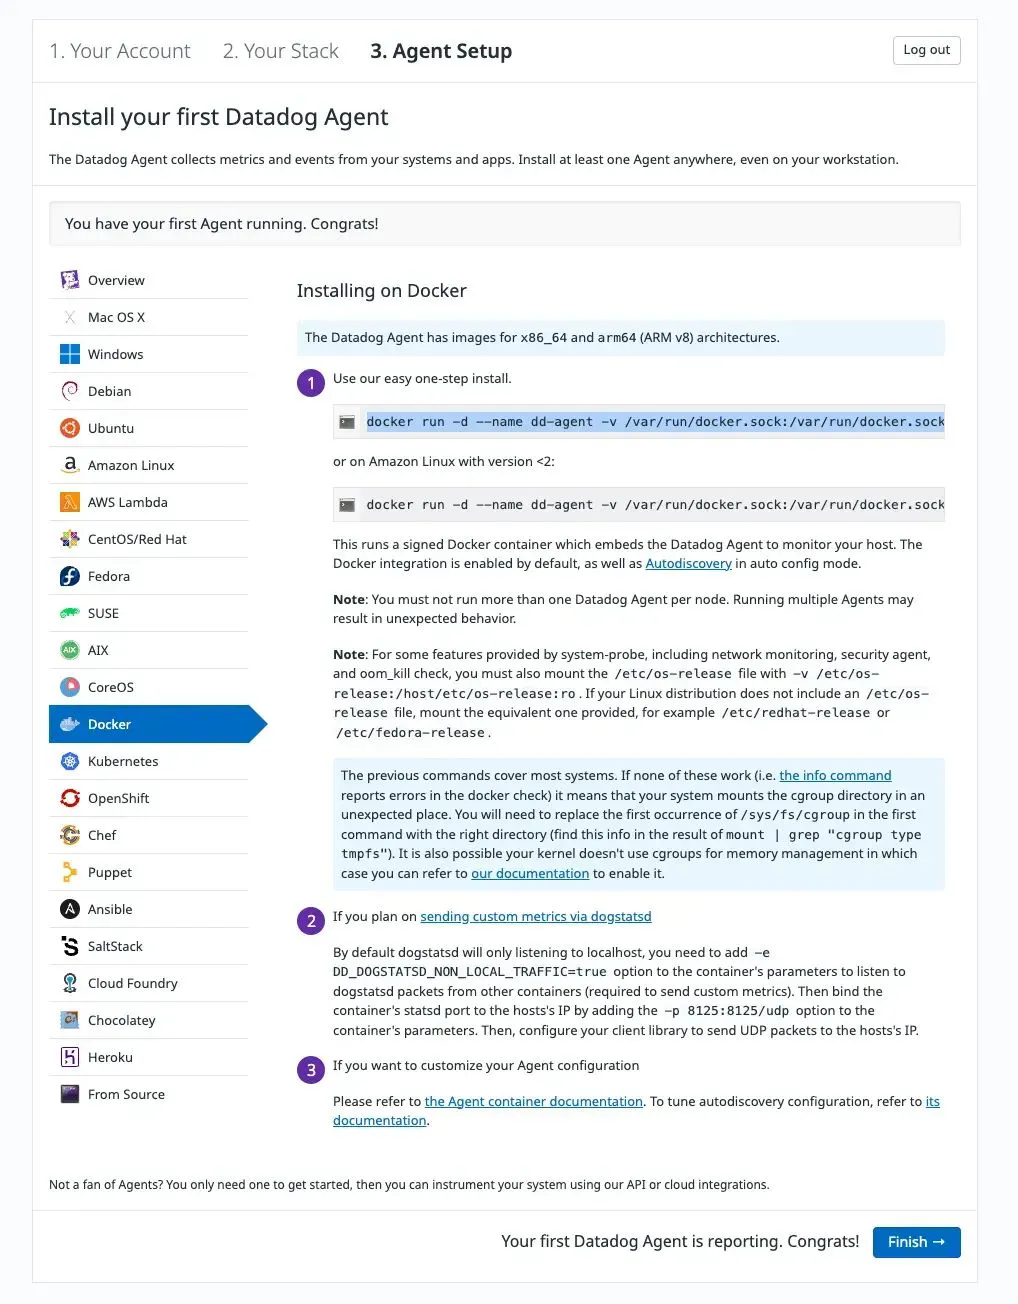
-
after you click ‘Next’, comes the most important part. You would be given the ‘agent setup’ instructions. My local machine is MacOSX, so I chose it appropriately. Please note down the DD_API_KEY and DD_SITE values, as they will be used in the subsequent steps.


Step 2— Datadog Agent Installation:
For MacOS, you could install via

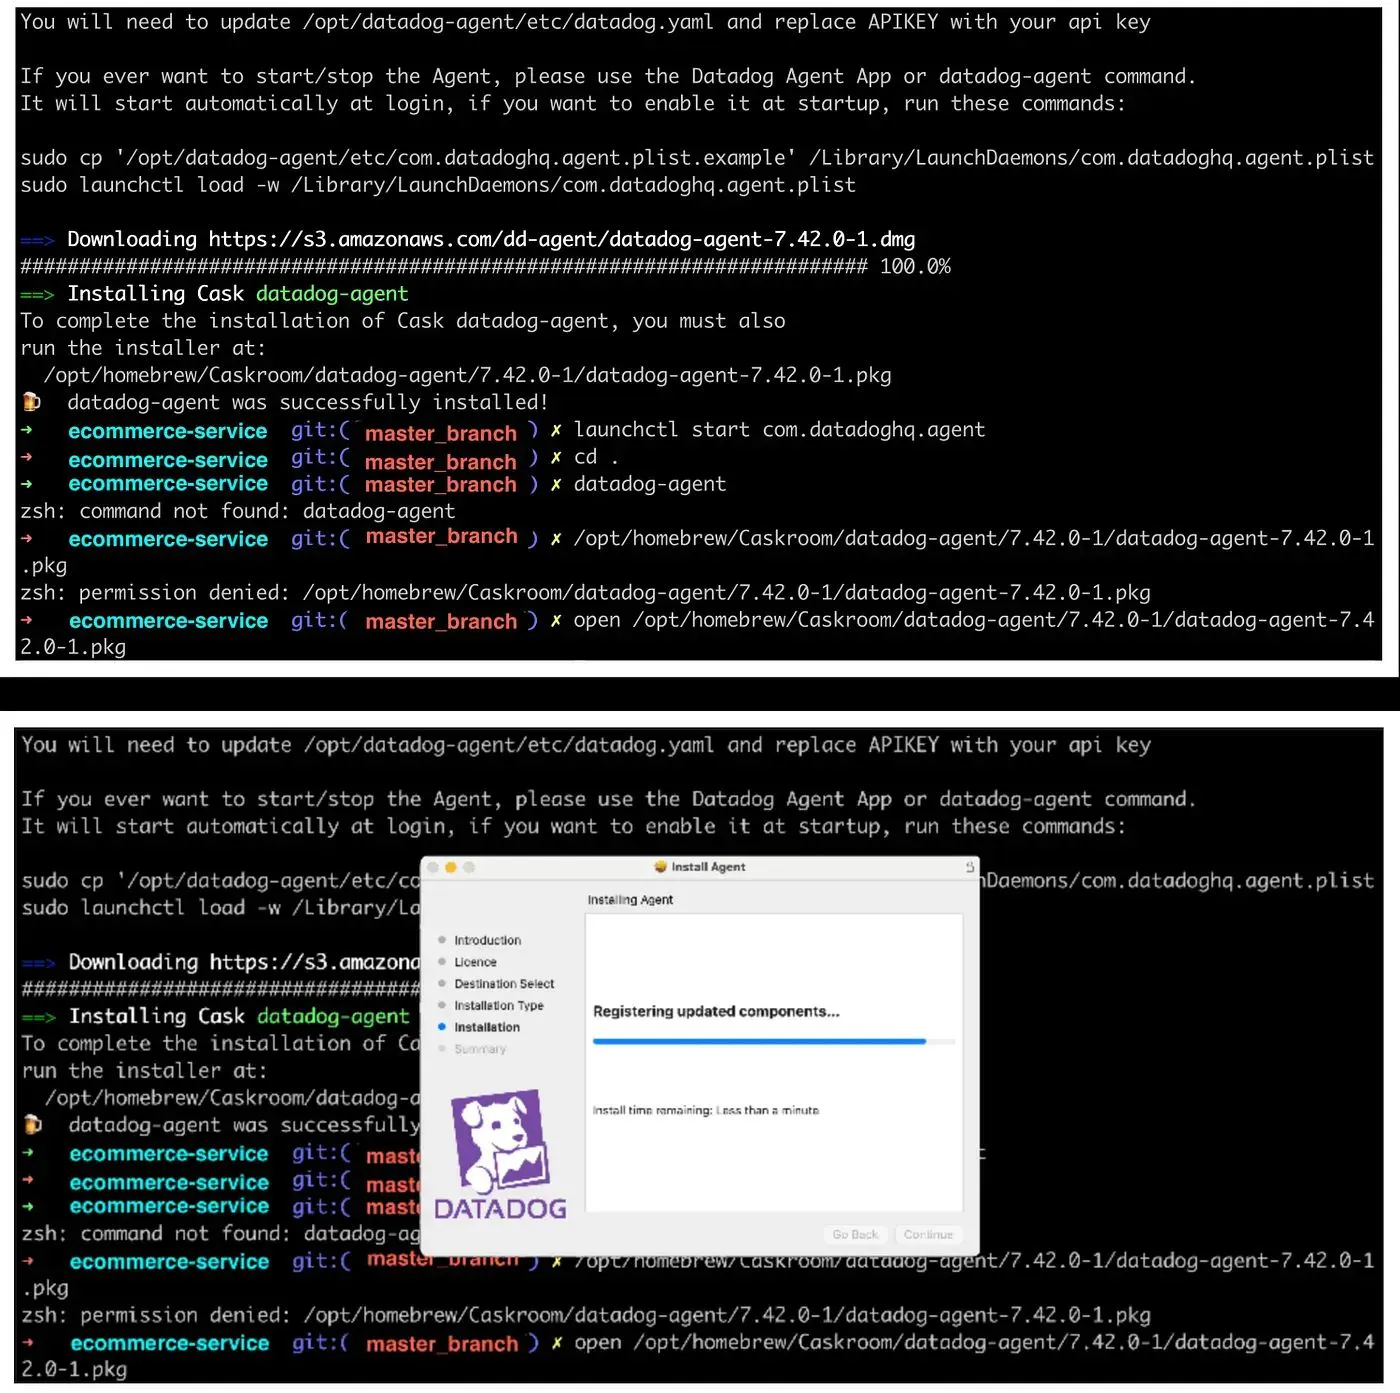
-
Customize the
datadog-agentas shown below


-
After the above step is completed, you’ll be asked to ‘Finish’ in the Datadog-web-UI.

- You’ll be prompted to add any
integrations. You could addJava,Dockeretc (as per your project needs).
Step 3 — Install Datadog tracer:
-
Download the
dd-java-agentjar fromhere ²
-
For your Java application, make sure you’re using a version of Java that comes with an in-built FlightRecorder. This is needed for tracing. OpenJdK8 comes with an inbuilt FlightRecorder. If you’re using Oracle Java, you need a commercial license to use **FlightRecorder.**³
Running your application:
- add the VM options for our java application:
-javaagent:"/Users/home/Downloads/dd-java-agent.jar" -Ddd.profiling.enabled=true -Ddd.logs.injection=true -Ddd.agent.port=8126 -Ddd.service=ecommerce-service -Ddd.env=local -XX:FlightRecorderOptions=stackdepth=256


- If you are using a
gradletask, you can include thejvmArgsas below:


jvmArgs = ["-javaagent:/Users/home/Downloads/dd-java-agent.jar", "-XX:FlightRecorderOptions=stackdepth=256", "-Ddd.profiling.enabled=true", "-Ddd.logs.injection=true", "-Ddd.agent.port=8126", "-Ddd.service=ecommerce-service", "-Ddd.env=local"]
- Now start your Java application. If the tracing is happening correctly, you should see the below logs:


Logging in Datadog:
- To enable logs to be streamed to Datadog, follow the instructions in the Datadog Web UI. ⁴

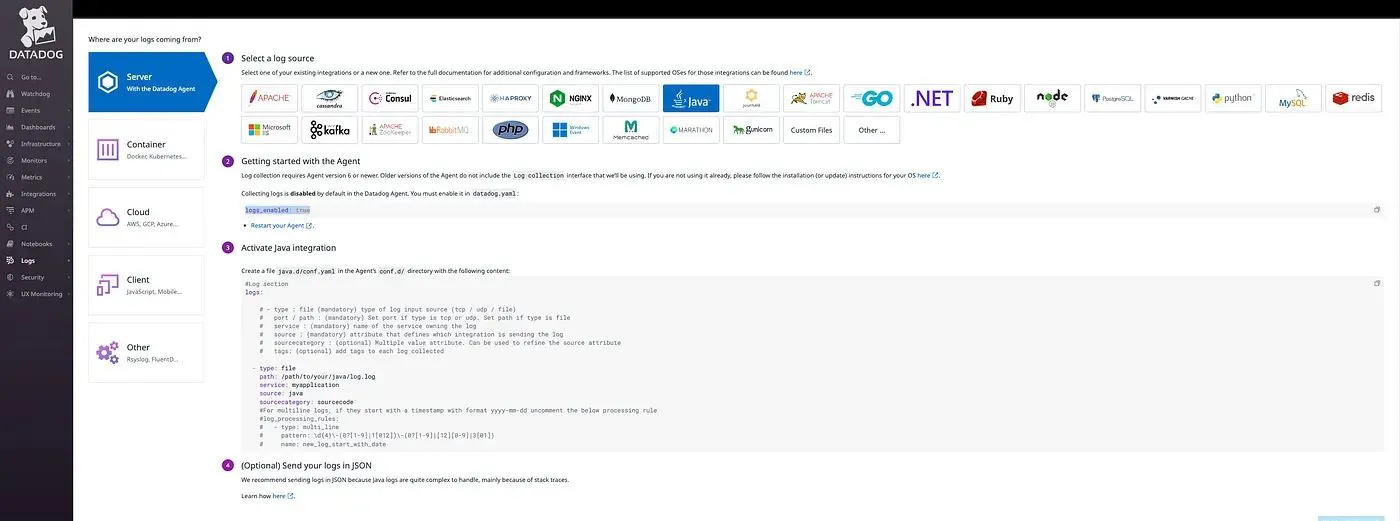
- For
macOS— Config directory is~/.datadog-agent/conf.d/java.dand the file is present at~/.datadog-agent/conf.d/java.d/conf.yaml


-
and now, the
logsshould start flowing in Datadog.


Some Tips:
-
Add appropriate
debuglogs at the beginning and end of each method in your application. It’s very useful while debugging.
-
Add a mechanism to inject
span idandtrace id. It’s an amazing lifesaver and puts the logs in proper context.⁵
Conclusion:
Once I had the Datadog agent up and running locally, I was able to view all the requests contextually.


And voila! All of my end-to-end tests are passing now 🙂 Happy logging!
Additional Info:
-
¹Alternatively, you could also download the
dmg package and install it. This link can also be obtained in the above ‘Agent Setup’ step (refer to screenshot)
-
²Direct download the
dd-trace-java jar.
-
³ Starting from JDK 11, we may use
FlightRecorderwithout activating anything. More details can be foundhere .
-
⁴More details are
here .
-
⁵If your application is Java, you could you this library
spring-cloud-sleuth for addingspan_idandtrace_idto the request.

L O A D I N G
. . . comments & more!
. . . comments & more!
About Author

TOPICS
Languages


THIS ARTICLE WAS FEATURED IN...


RELATED STORIES


10 Best Practices for Securing Your API #api-security
Feb 14, 2023

